|
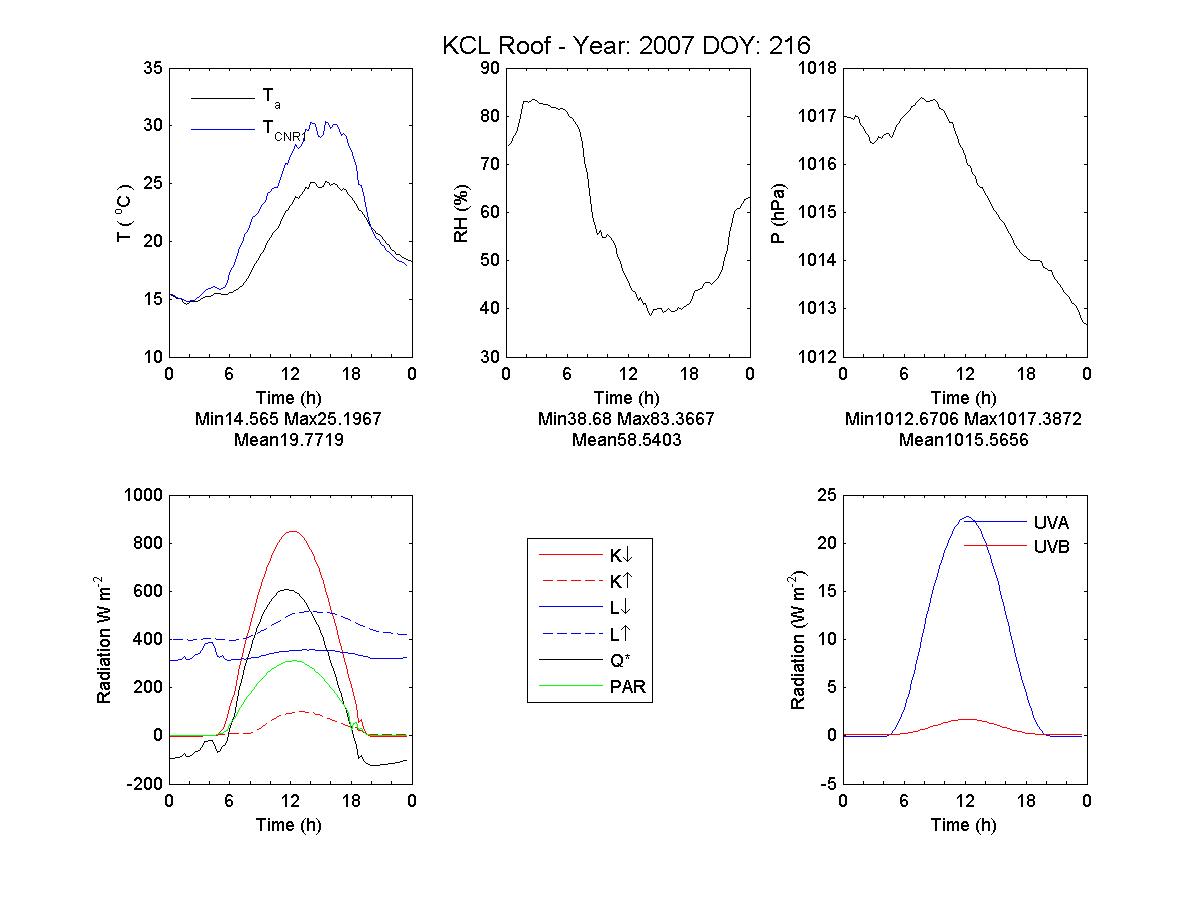
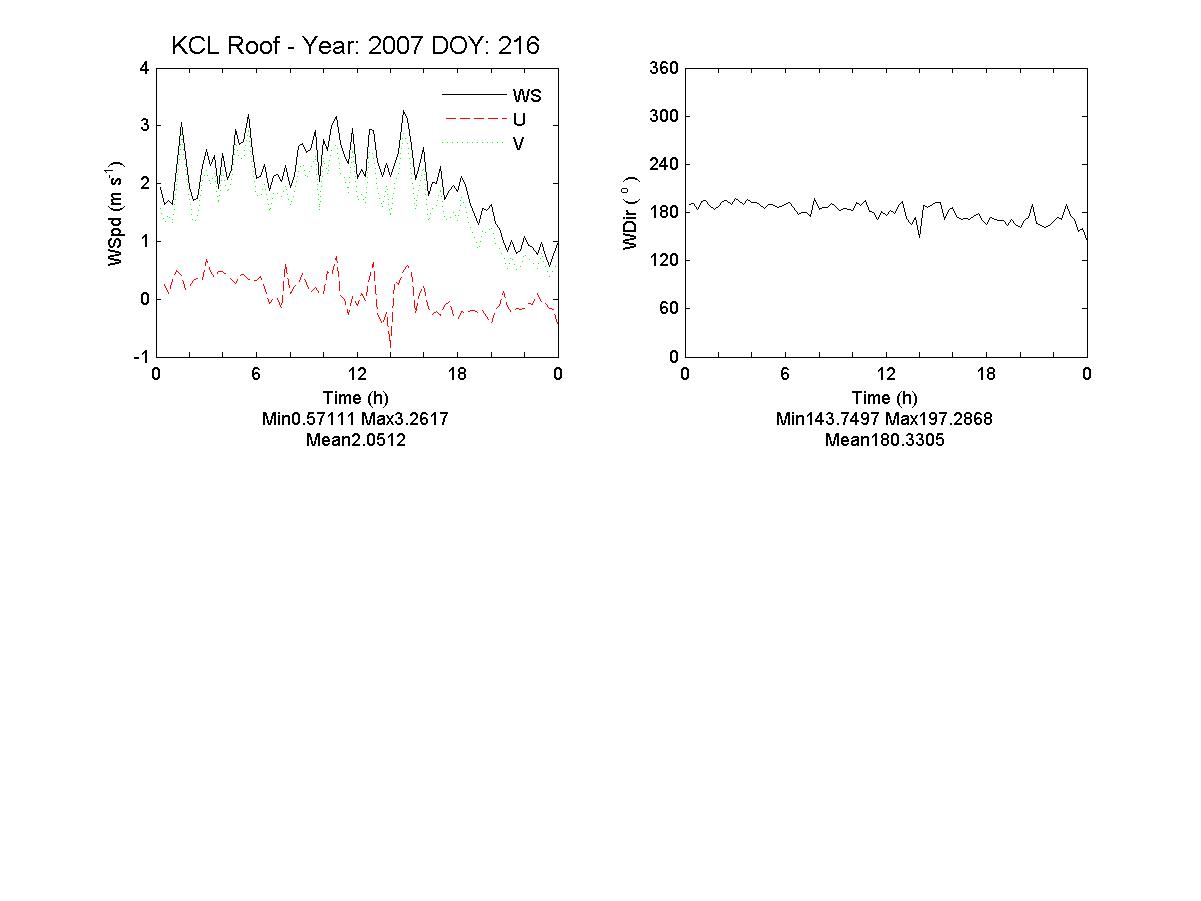
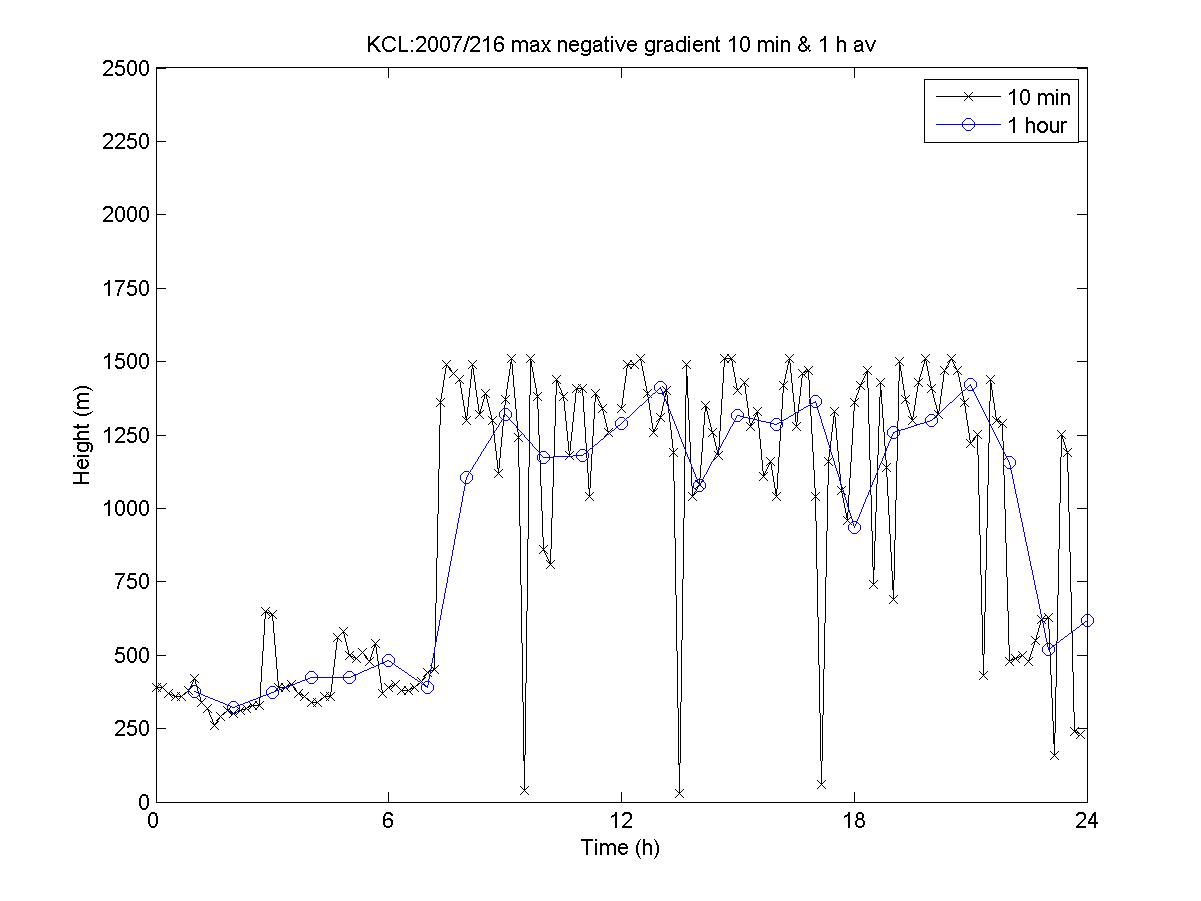
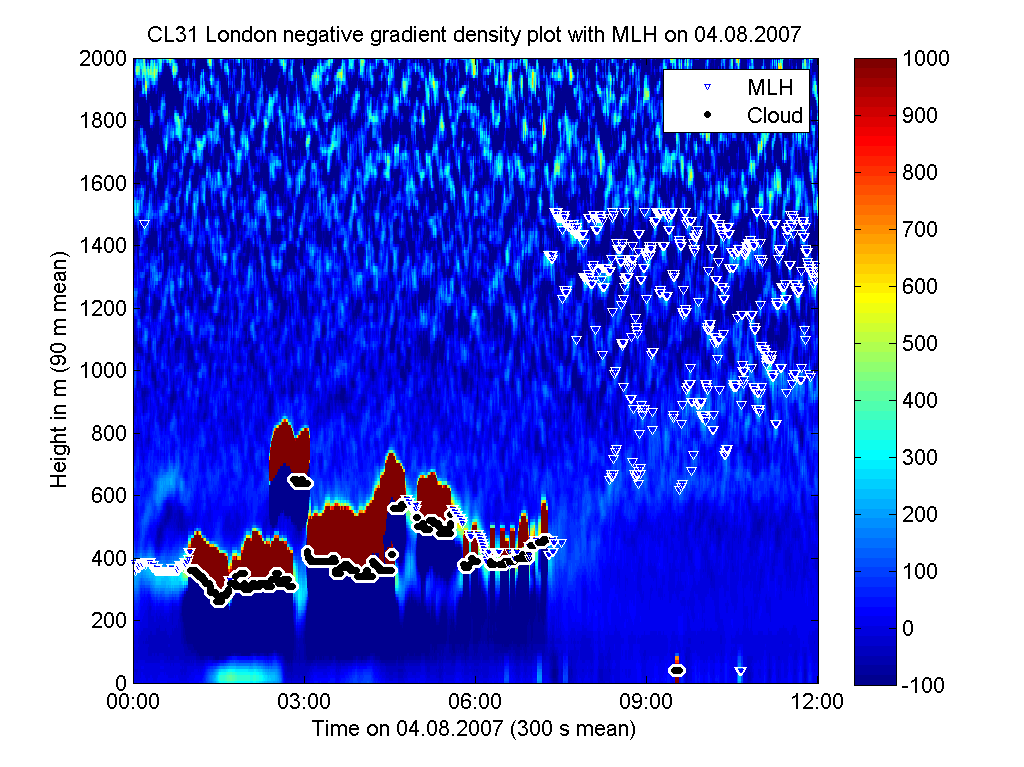
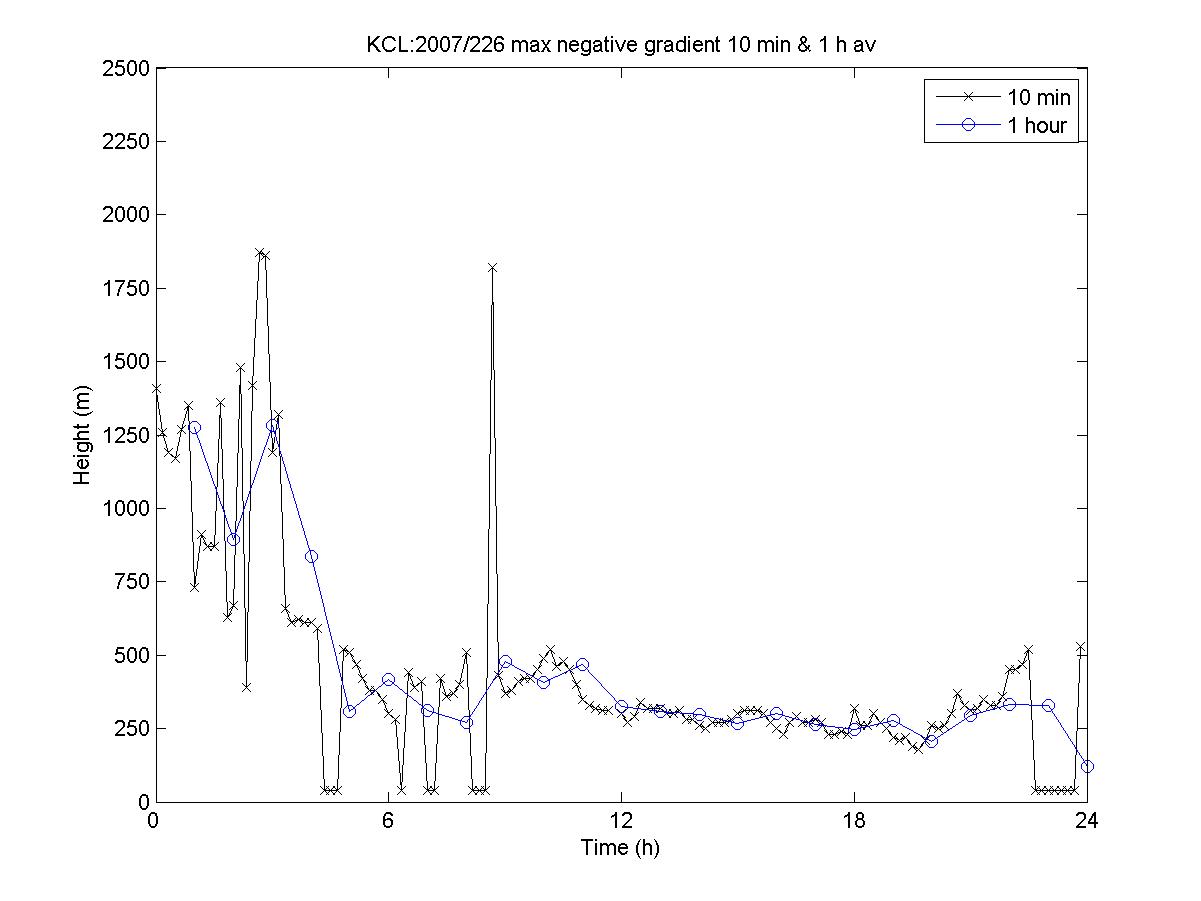
Clear Sky conditions Ceilometer
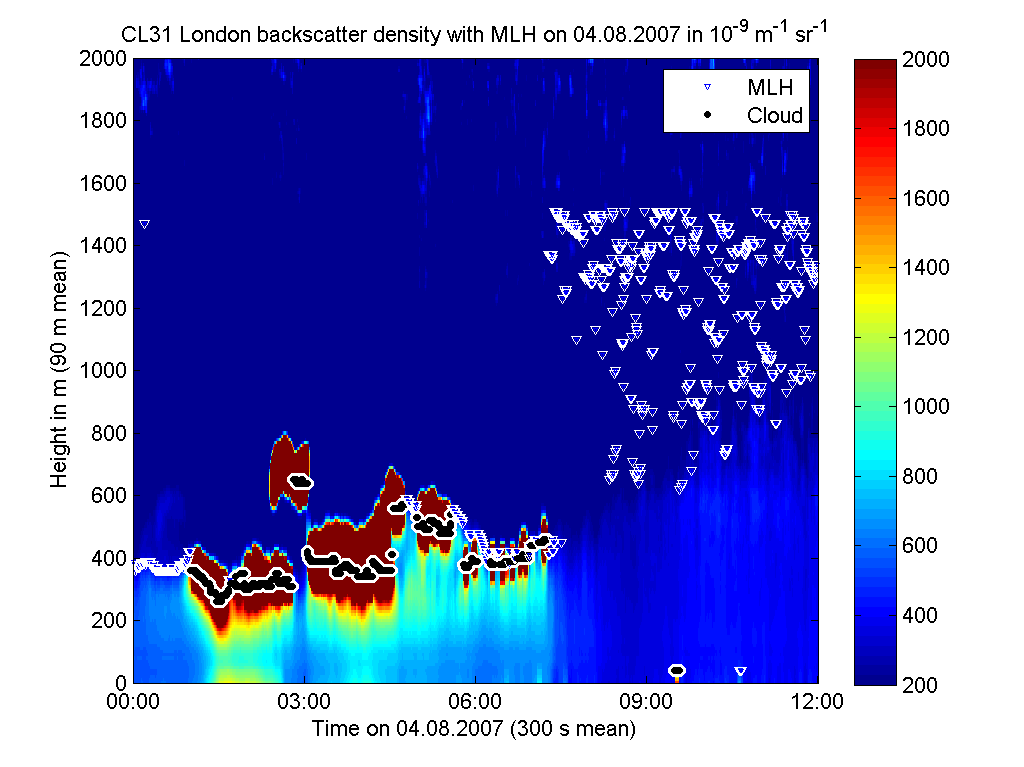
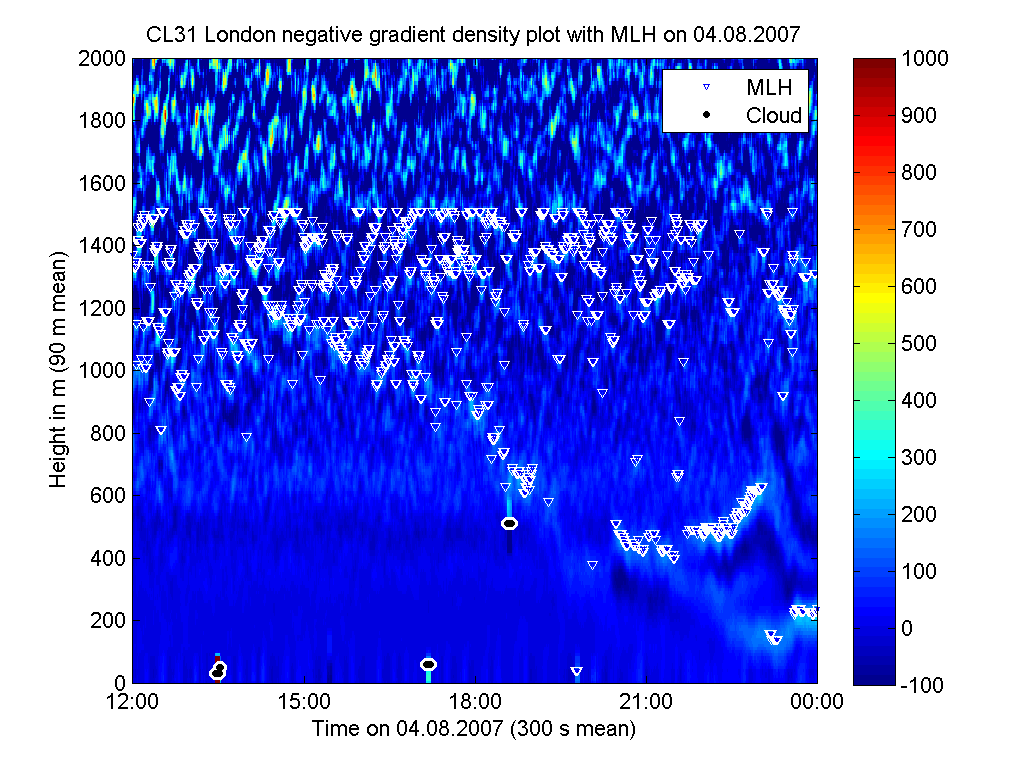
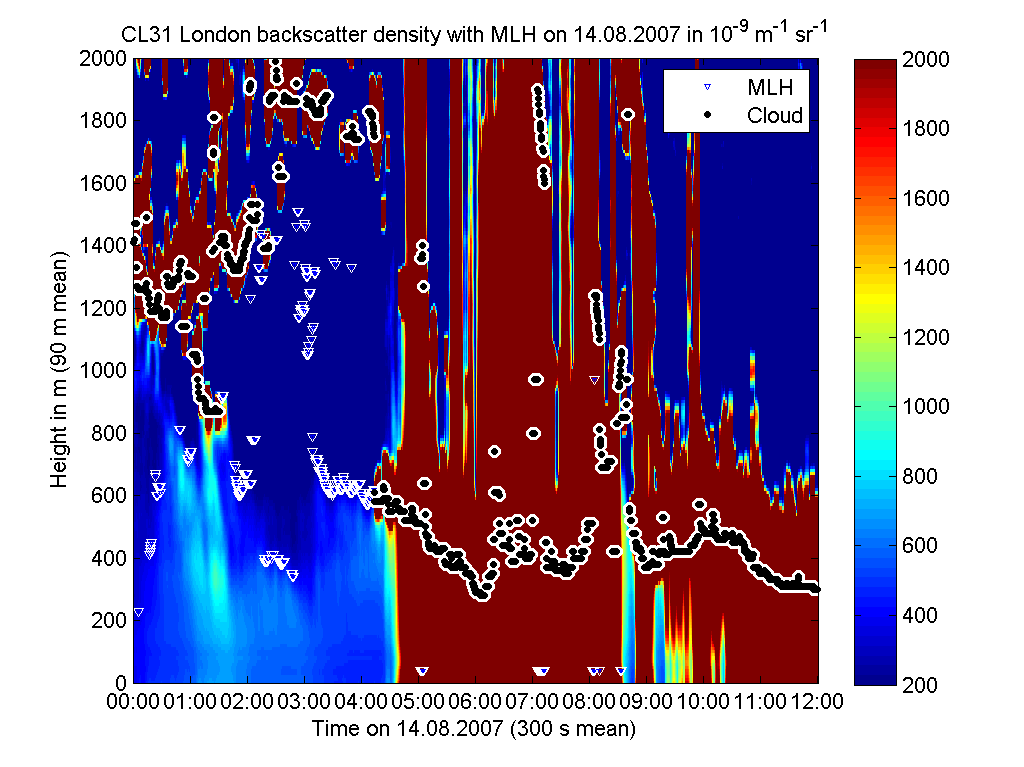
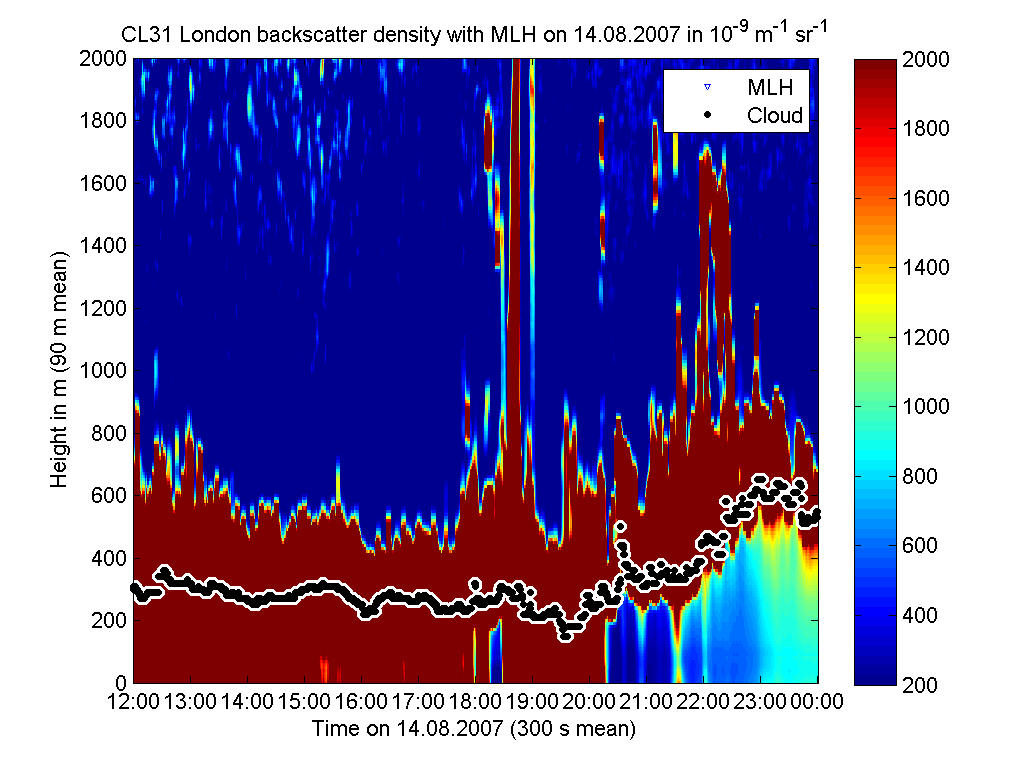
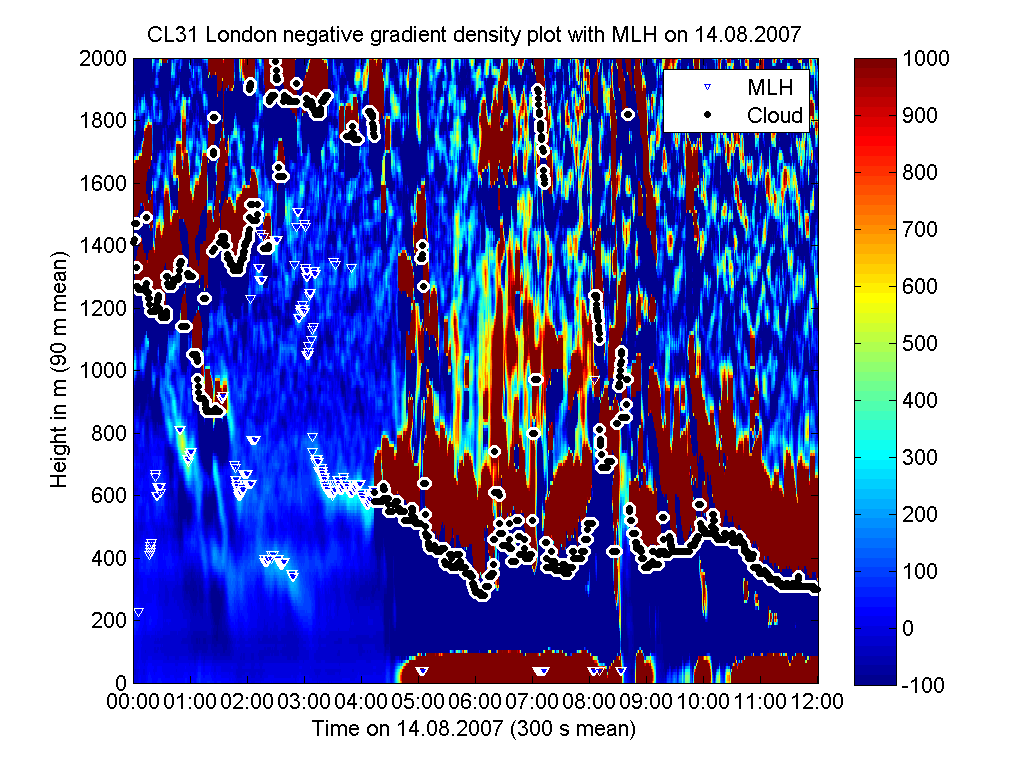
Very cloudy conditions Ceilometer
To see the plots more clearly click on them |
| These are all provisional data and are only for internal use. If you are interested in this data please contact Prof Sue Grimmond. |
|
Clear Sky conditions Ceilometer
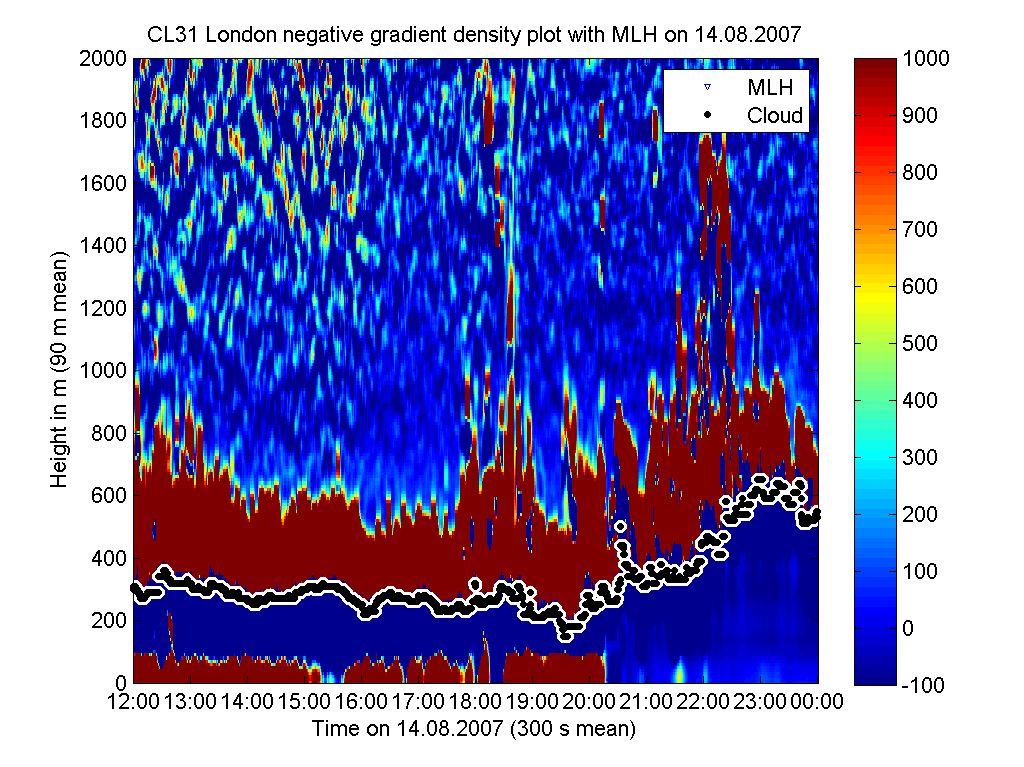
Very cloudy conditions Ceilometer
To see the plots more clearly click on them |
| These are all provisional data and are only for internal use. If you are interested in this data please contact Prof Sue Grimmond. |