Micrometeorological Monitoring
Key People:
Prof Sue Grimmond
Mariana Gouvea
Simone Kotthaus
Thomas Loridan
Duick Young
Three Monitoring sites on rooftops in the centre of London:
SK – Strand Campus, King’s Building
SS – Strand Campus, Strand Building
RGS – Building of the Royal Geographical Society
Current conditions at KCL
Meteorological observations at monitoring sites 1 and 2 (SK, SS):
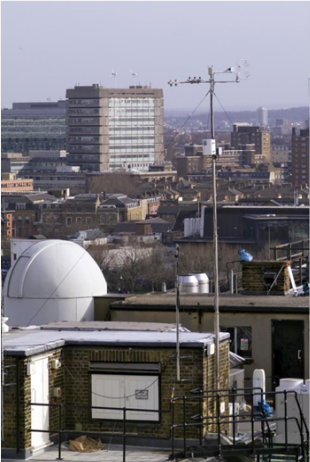
Radiation
Incoming & outgoing long- and shortwave radiation: CNR1 (Kipp & Zonen)
UVA, UVB, PAR: SKU420, SKU430, SKL2620 (Skye Instruments)
Barometric pressure
Automatic weather station WXT510 (Campbell Scientific)
Wind speed and direction
CSAT3, WXT510
Humidity
Relative Humidity: WXT510
H2O concentration: LI840, Li7500 (Campbell Scientific)
Precipitation
WXT510, ARG100 tipping bucket (Campbell Scientific)
roof
Cloud observations at monitoring sites 2 and 3 (SS, RGS):
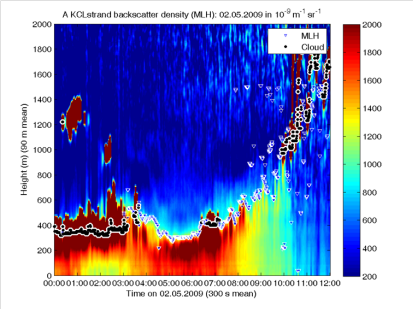
Two Ceilometers: CL-31 (Vaisala)
Backscatter profiles allow for estimation of cloud height, mixing layer height & aerosol content
Sites approx. 4.5 km
apart
High frequency laser
pulses to negate low power, background
noise
Continuous operation
– data reported every 15 s
ceil
Eddy Covariance measurements at sites 1 and 2 (SK, SS)SK Flux Tower: CSAT3 and Li7500(Campbell Scientific)
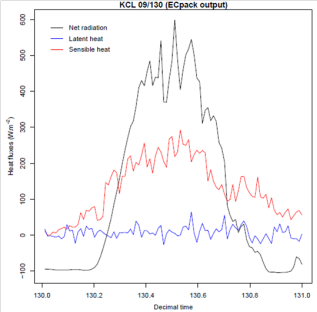
Turbulent fluxes of sensible and latent heat, momentum and CO2
SS Flux Tower: CSAT3 and 2 Li840 (Campbell Scientific)
Turbulentfluxes of sensible and latent heat, momentum and CO2
Verticalprofile of CO2 and H2O
Data processing
R based spike removal routine (Vickers and Mahrt 1997)ECpack – flux processing software (van Dijk et al. 2004)TK2 – flux processing software (Mauder and Foken 2004)
d
Scintillometry at Strand Campus & Remote sensing of sensible heat flux
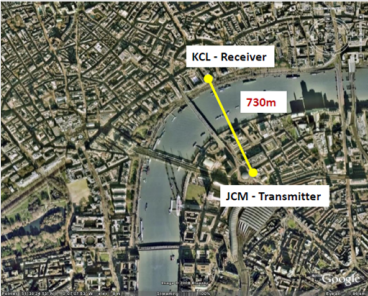
Small Aperture Scintillometers (Scintech)
(with J. Salmond, University of Auckland)
Path length < 0.25 km
Large Aperture Scintillometers (Kipp & Zonen)
Path length 0.25 km – 4.5 km*
Data processing
Iterative composite method: depending on atmospheric stability conditions
map
Spatial distribution of meteorological observations
Build data base for Greater London by combining several public sources:
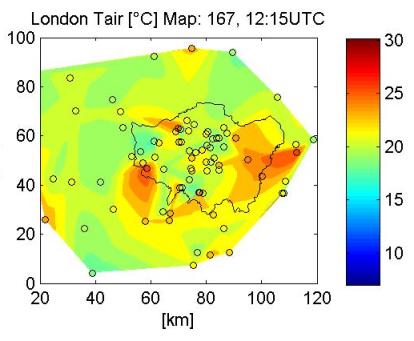
Synoptical Sites
operation under WMO standard
London Air Quality
Network
London Grid for Learning
Weather Underground
Meteorological Observations:
Wind speed, wind
direction
Air temperature, dew
point temperature
Relative humidity
Incoming solar radiation
Barometric pressure
Precipitation